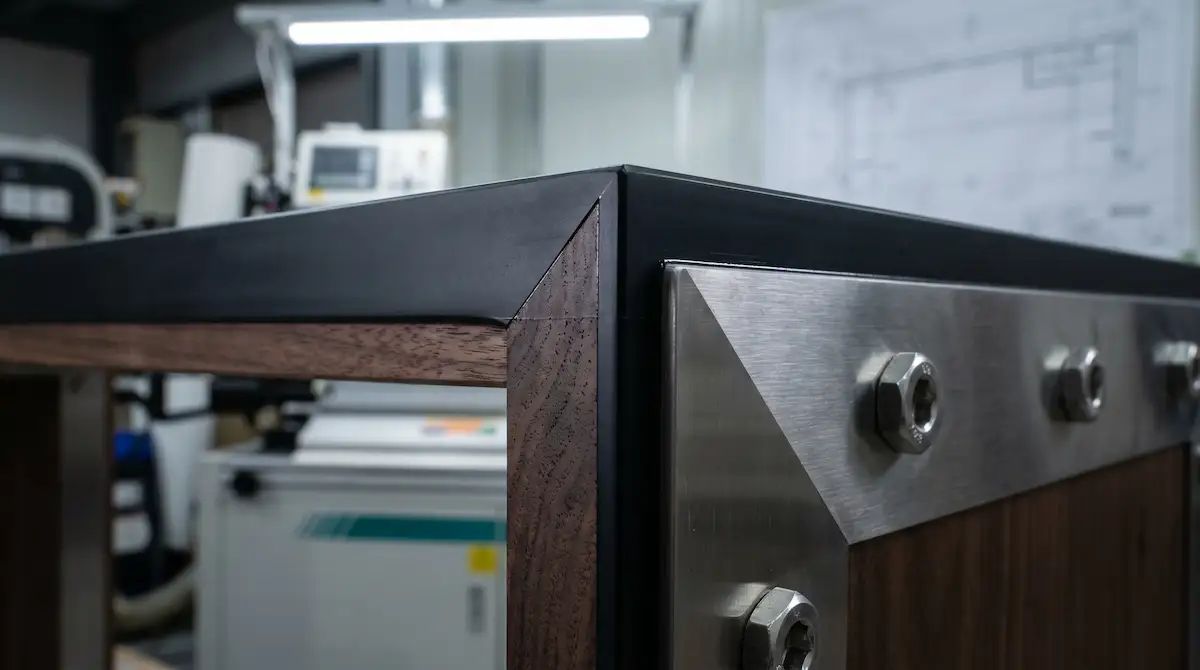
An Austrian hydraulic slide arrives 30 days after order when the route is clear, and 90 when a port backs up. Commodity screws on the same project vary by three days. That spread is what decides how a line item is sourced. Stable, substitutable items stay on just-in-time (JIT), where cash is not tied up in a warehouse. Specified board and imported hardware sit on 45 days of physical buffer stock — warehouse rent and working capital spent so the build programme does not track someone else’s sailing schedule. That carrying cost belongs in the quoted price, not behind the promised handover date.
During traditional B2B procurement strategies and low-bid tendering, developers frequently fall victim to “Black-Box Supply Chains” and severe information asymmetry. Tender proposals promise 60-day turnarounds, but the schedule behind them usually runs on Just-In-Time (JIT) sourcing across several tiers of sub-contracting—joinery workshops wait on metal mills, metal shops wait on powder-coaters, and hardware sits stranded at overseas ports. When developers are blindsided by delivery defaults two weeks before the soft opening, site contractors idle, launch campaigns are rescheduled, and the room revenue foregone each day equals keys times ADR times forecast occupancy.
Sunder integrates B2B Value Engineering (VE) and Supply Chain Transparency Engineering, breaking delivery risk into nodes that can be checked: 45 days of physical stock on critical materials, MES station scans, and a white-body FAT before finishing.
1. Cost of Delay (CoD) Mathematical Financial Model
In institutional commercial real estate, project time carries an unyielding financial price tag. The daily cash burn of delayed opening is modeled as:
+-------------------------------------------------------------------------+
|                  Daily Cumulative Cost of Delay (CoD) Model             |
+-------------------------------------------------------------------------+
|  Daily Cash Burn (NTD/Day)                                              |
|    ▲                                                                    |
|    │ ┌────────────────────────────────────────────────────────────────┐ |
|    │ │ 1. Net Room Revenue Loss (300 keys x ADR NT$6,000 x 75% =1.35M)│ |
|    │ ├────────────────────────────────────────────────────────────────┤ |
|    │ │ 2. Capital Interest Sunk Cost (NT$ 500M Capex x 7% WACC / 365) │ |
|    │ ├────────────────────────────────────────────────────────────────┤ |
|    │ │ 3. Site Contractor Idle Payroll & General Conditions (NT$ 85k) │ |
|    │ └────────────────────────────────────────────────────────────────┘ |
|    │  ➔ 300-Key Luxury Hotel: Burns > NT$ 1,530,000+ per delayed day!   |
|    │  ➔ 14-Day Delivery Delay: Generates > NT$ 21,420,000+ direct loss  |
|   0└────────────────────────────────────────────────────────► Delay Days|
+-------------------------------------------------------------------------+
2. Conventional Fragmented JIT Black-Box vs. Sunder 4-Tier Defense
+-------------------------------------------------------------------------+
|     Conventional Black-Box Outsource vs. Sunder Vertical Digital Model  |
+-------------------------------------------------------------------------+
|  【Conventional Low-Bid Black Box (JIT Zero-Inventory / Fragmented)】   |
|   Core board shortage ──► Metal waits on wood ──► Late tolerance clashes|
|   ➔ 30-Day Project Delay & Multi-Million-Dollar Revenue Evaporation     |
|                                                                         |
|  【Sunder Vertically Integrated Delivery Assurance Hierarchy】         |
|   ┌─────────────────────────────────────────────────────────────────┐   |
|   │ 1. 45-Day Buffer Stock (E0 Birch multi-ply, HPL, Austrian slides)│  |
|   ├─────────────────────────────────────────────────────────────────┤   |
|   │ 2. 5-Axis CNC Direct Link (CAD/CAM models compiled to G-code)   │   |
|   ├─────────────────────────────────────────────────────────────────┤   |
|   │ 3. MES Barcode Cloud Tracking (Real-time station milestone data)│   |
|   ├─────────────────────────────────────────────────────────────────┤   |
|   │ 4. 100% White Body FAT Pre-Assembly (Zero factory-gate tolerance)│  |
|   └─────────────────────────────────────────────────────────────────┘   |
+-------------------------------------------------------------------------+
3. 4 Core Supply Chain Assurance & Delivery Engineering Protocols
Sunder transforms “delivery certainty” into verified manufacturing specifications:
1. 45-Day Critical Raw Material Physical Buffer Stock
- Sunder maintains a standing 45-day inventory of project-critical JIS F☆☆☆☆ Birch multi-ply boards, EN 438 HPL sheets, Q235B structural steel tubing, and Austrian hydraulic dampers in dedicated factory warehouses.
- Contains the effect of port congestion and commodity price movement inside that 45-day window. The tactic only works on long-lead items whose specification is frozen; a bespoke fabric or custom hardware still under design review can be bought early and then scrapped, so those stay on JIT with the freeze date written into the contract.
2. Digital CAD/CAM G-Code Machine Tool Compilation
- Approved shop drawings compile directly via CAM post-processors into numerical G-code transmitted directly to 5-axis CNC routers, which removes the manual transcription step where dimensions are most often lost.
- Batch nested panel sizing maintains dimensional tolerances within .
3. MES Digital Barcode Station Tracking & Client Portal
- Every structural element receives a unique QR code scanned across 7 discrete work centers: Panel Sizing, Edge Fusion, CNC Machining, Coating, Assembly, QC Inspection, and Export Packaging.
- Project stakeholders monitor real-time completion percentages across guestroom floors via a cloud-based digital dashboard.
4. 100% Factory Acceptance Test (FAT) White Body Pre-Assembly
- Before finishing, all multi-material joinery units undergo 100% structural dry-fit assembly on dedicated steel alignment jigs, so tolerance stack-up is found in the factory rather than in the corridor.
4. Actuarial Quantification: Low-Bid Delay vs. Sunder On-Time Handover
300-Key Hotel Delivery Delay vs. Contracted Handover Actuary
| Actuarial Parameter | Low-Bid Black Box | Sunder Delivery |
|---|---|---|
| Contracted Handover Schedule | 60 Days (Verbal) | 60 Days (MES-Gtd) |
| Actual Job-Site Delivery Delay | 14 Days Default | 0 Days On-Time |
| 14-Day Net Room Revenue Loss | NT$ 18,900,000 (Lost) | NT$ 0 (Captured) |
| Site Contractor Idle Payroll | NT$ 1,190,000 | NT$ 0 |
| Launch Campaign Breach Claims | NT$ 1,500,000 | NT$ 0 |
| Total 14-Day Delay Sunk Cost | NT$ 21,590,000 (Lost) | NT$ 0 |
| Initial Bid Price Delta | Appears NT$ 1.5M Lower | Baseline |
| True Net Financial Impact | Net Deficit > NT$ 20M+ | Net Revenue Win |
The model above assumes 300 keys, NTD 6,000 ADR, 75% occupancy, NTD 500M total investment and a 7% WACC, which prices a 14-day delay at roughly NTD 21,000,000. It is a model, not a measurement: where the slip lands inside the pre-opening float, or affects only some floors, the real figure is much smaller.
5. Total Cost of Ownership (TCO): Black-Box Outsource vs. Sunder Transparent SOP
10-Year TCO Evaluation: Black-Box Sourcing vs. Sunder Delivery SOP
| Evaluation Vector | Fragmented Black-Box | Sunder Transparent |
|---|---|---|
| Schedule Reliability | Low (Unmonitored delays) | 100% On-Time MES |
| Material Traceability | Untraceable (Substituted) | 100% Barcode Mill |
| Factory Pre-Inspection | Spot checks or none | 100% White Body FAT |
| Site Installation Clashes | High (Field sawing required) | Zero Clashes (KD) |
| 10-Year Cumulative TCO | Baseline (100% + Delay Loss) | Reduced to 30% |
6. Conclusion: Break the Handover Date into Checkable Nodes
In institutional commercial hospitality, “on-time delivery” is the primary financial lifeline protecting property ROI. The cost of each day is what the CoD expression above computes.
Sunder embeds 45-day raw material buffer stock, MES digital barcode tracking, and 100% factory White Body FAT into contract execution. Three things are worth requiring at tender: the list of line items held in buffer stock and their cover in days, whether MES station records are open to the client, and the scheduled date of the white-body FAT. Written into the contract, those predict the outcome better than a promised lead time does.
Further Reading
- Hotel Room Functional Furniture & MEP Integration Engineering: Pre-Routed Wire Management, Thermal Dissipation Channels, and Quick-Release Maintenance in Nightstands, Mini-Bars, and TV Consoles
- Hotel Furniture RFP & Tender Specification Defense: Securing Quality Craftsmanship and Project Delivery Schedules
- Hotel Occupied Renovation & Phased FF&E Procurement: Zero Downtime Scheduling and Asset Revenue Protection